Housing Intelligence
Free · No fees or adsFind a place
About these figures
About these figures
- Property parcels
- 3,480,497Distinct NJ parcel identifiers
- Property sales records
- 1,398,840NJ sales-ratio archives 2020–2026 YTD
- Source datasets
- 61Across the project
- Places to explore
- 1,183New Jersey · counties, towns & ZIP areas
1,136,334 dated metric records across 208 measures sit behind the analytical views. Parcel totals count distinct nonblank PAMS parcel identifiers in the current landed NJ MOD-IVMOD-IV. New Jersey’s property tax assessment records, kept by the Division of Taxation: a record for every parcel, with its assessed value, property class and year built. composite—not annual assessment rows or only residential homes. Sales totals count SR1ASR1A. New Jersey’s record of each property sale, compiled from deeds by county tax boards, with the price, date and property. The sale prices here are the arm’s-length ones, not listings. reporting records, deduplicated by county, district, serial number and assessment year; they include non-market transfers and records not matched to a place page. These are not deed documents. Archive labels are sales-ratio years (July–June), not calendar-year coverage; YTD is the publisher’s open archive label.
Calculated from the data available at build time—not a live counter. Source datasets count the external-source catalogue listed in Data provenance, including supporting maps, directories and uncertainty data—not separate institutions. The platform’s own calculated metrics are excluded. Metric records count dated observations in the warehouse across loaded geographies, including national/state series and calculated measures—not raw rows processed, independent measurements or individual homes.
Places count New Jersey county, municipality and ZIP pages with at least one metric observation. Coverage varies: a page does not mean every measure is available. The artwork illustrates assembly; its marks are not one-to-one records or a trace of individual homes.
Tools
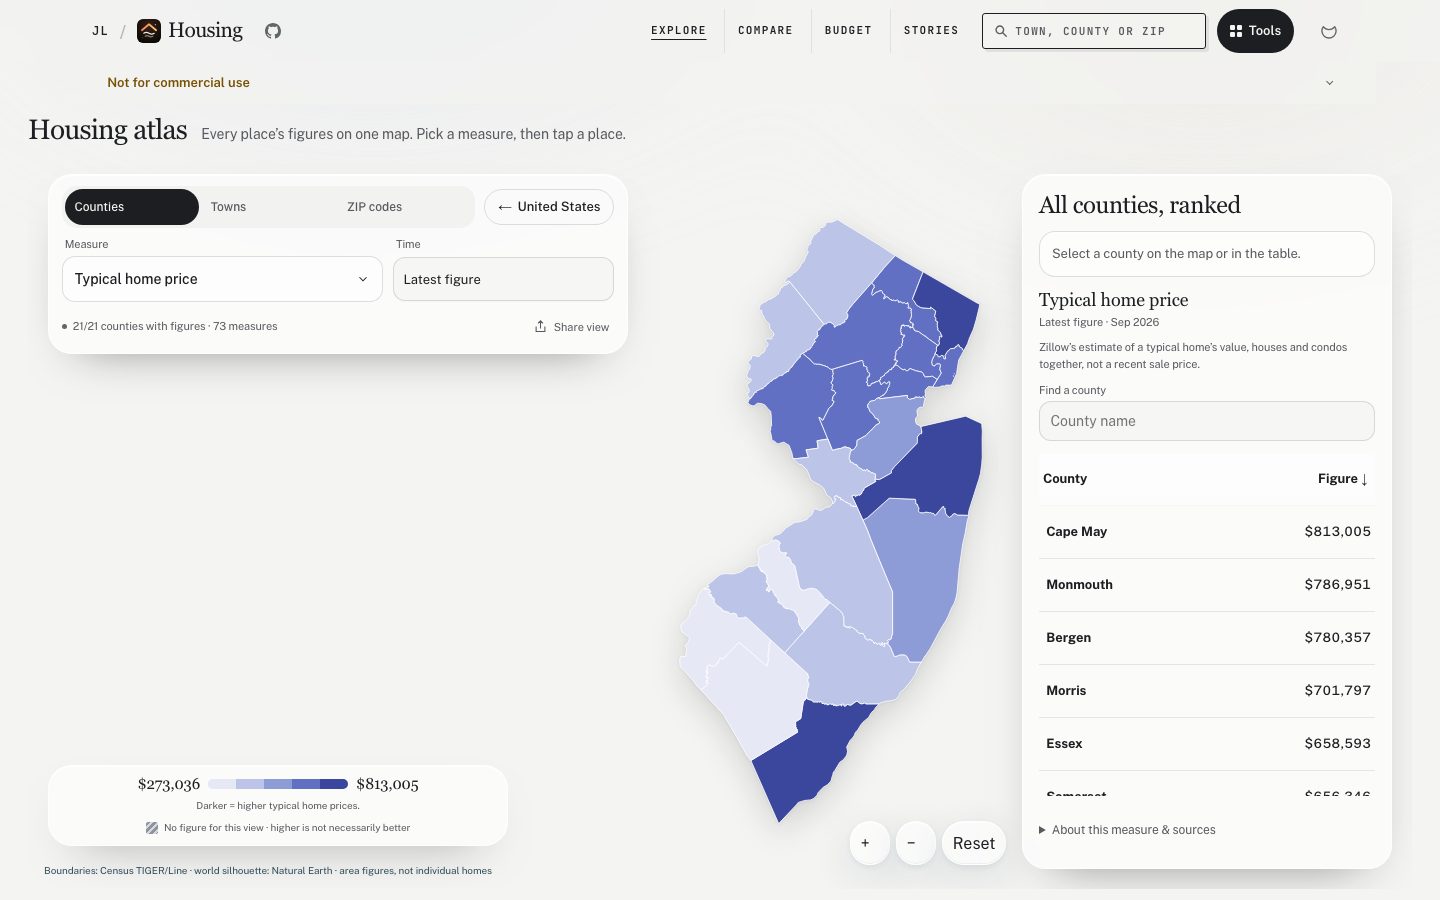
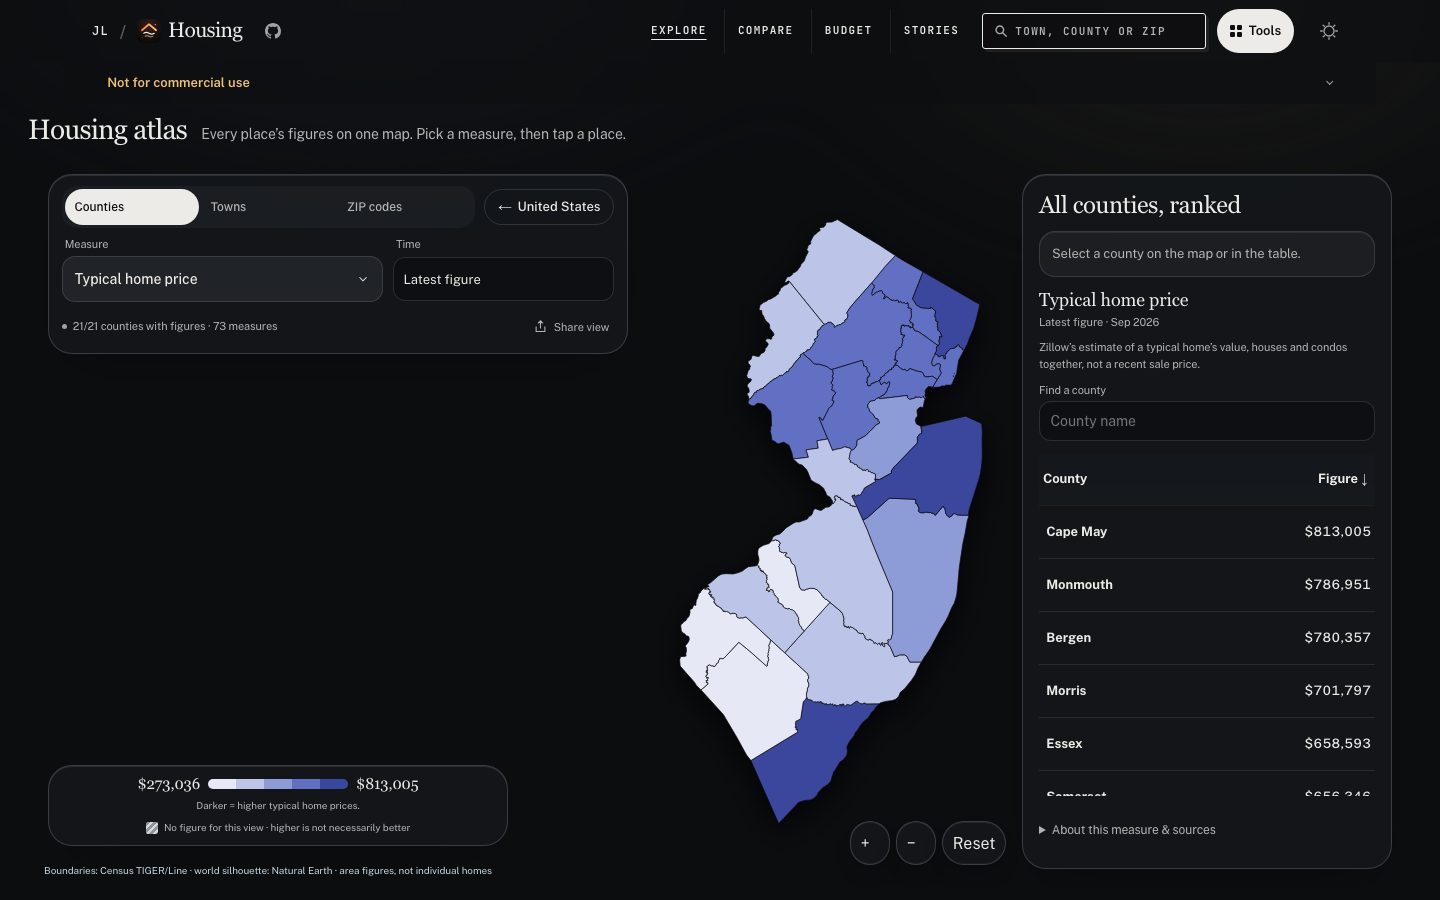
New Jersey coverage




US market
Latest through Oct 2026 · vs. a year earlier · easier harder for buyers and renters
Borrowing costs more
A typical 30-year mortgage rate is 7.32%, against 6.19% a year ago. On a typical new home ($410,700, with 20% down), that is about $250 more a month.
More homes to choose from
5.4% more homes are for sale than a year ago. A typical home sells in 61 days, and about 1 in 3 listings has had its price cut.
Prices still rising
Prices of the same homes rose 2.6% over the past year, about as fast as the year before.
Rent increases easing
Rents rose 2.8% over the past year, against 3.4% the year before.
Fewer homes being built
Construction began on 7.4% fewer homes than a year ago. Unsold new homes would take 8.5 months to sell at today's pace, more than the roughly six months usually read as balanced.
Mortgage rate: 7.32%, Oct 22. +1.13 pts from a year earlier, harder for buyers and renters.
Mortgage rate: Benchmark7.32%Home prices y/y: +2.6%, Jul 2026. minus 0.1 pts from a year earlier, easier for buyers and renters.
Home prices y/y: Modelled+2.6%Homes for sale: 1.16M, Sep 2026. +5.4% from a year earlier, easier for buyers and renters.
Homes for sale: Records1.16MDays on market: 61 days, Sep 2026. minus 1 day from a year earlier, harder for buyers and renters.
Days on market: Records61 daysPrice cuts: 35.0%, Sep 2026. minus 0.1 pts from a year earlier.
Price cuts: Calculated35.0%Rent inflation: +2.8%, Sep 2026. minus 0.6 pts from a year earlier, easier for buyers and renters.
Rent inflation: Survey+2.8%Housing starts: 1.22M/yr, Sep 2026. minus 7.4% from a year earlier, harder for buyers and renters.
Housing starts: Survey1.22M/yrNew-home supply: 8.5 mo, Aug 2026. 0.0 mo from a year earlier.
New-home supply: Survey8.5 mo
History & definitions
Each line uses its own scale. Home prices and rent inflation are changes from a year earlier; the rest are levels. Historical figures, not forecasts.