State
New Jersey
The Garden State
Computed from the data · not AIComputed from the data, not AI. The figures, rankings, costs, profiles, summaries and maps on this page are assembled from published data by fixed rules, not written by AI. When a region includes a labelled interpretation inside its expanded detail, that is the one part a language model wrote.
Housing market†
Scope
Sale price covers qualifying residential sales—not the value of every home.
The effective rate is the property tax levied per $100 of a home’s market value, statewide; a town’s rate can be far higher or lower.
Homes sold counts qualifying residential sales over the whole window shown, not one year.
Statewide data
Statewide stories


The homes that sold
$520,000 median recorded sale
Recorded 1–4-family sales—not asking prices.
NJ Treasury · SR1A · Jan 2024–Jun 2026


Housing cost burden
77% of renters in the lowest income band are cost-burdened
Up to 30% of HUD area family income · survey estimate.
HUD CHAS · Census ACS · 2018–2022


Buyer financing
$445,000 median purchase mortgage
Historical loans—not current offers.
CFPB · HMDA · 2025


Building & demolition
12,201 net homes added
Preliminary · missing reports are not zero.
Census BPS / NJ DCA · 2025 · Preliminary


Sites & cleanup
7,734 site cleanups open in NJDEP’s records
Site records—not a property’s exposure or safety.
NJDEP site records · 2026 record snapshot


Internet availability
77.0% of mapped locations have a fiber offer
Mapped locations—not households or measured speeds.
FCC provider reports · 2025-12-31 · revised 2026-10-13
Visual stories
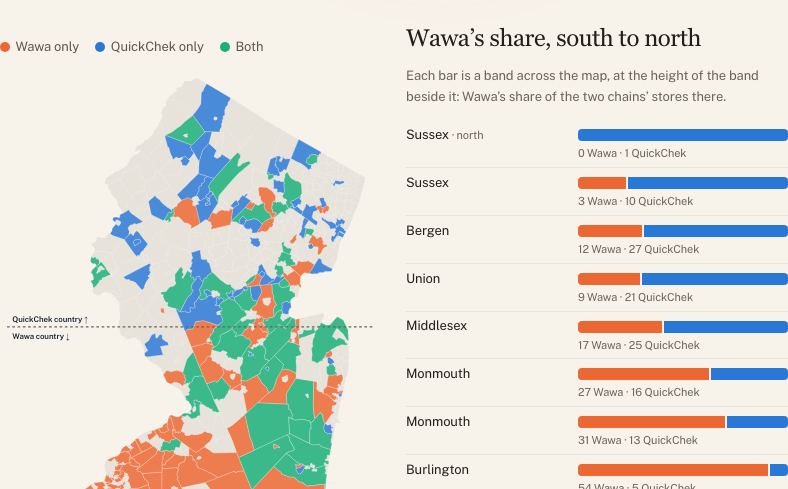
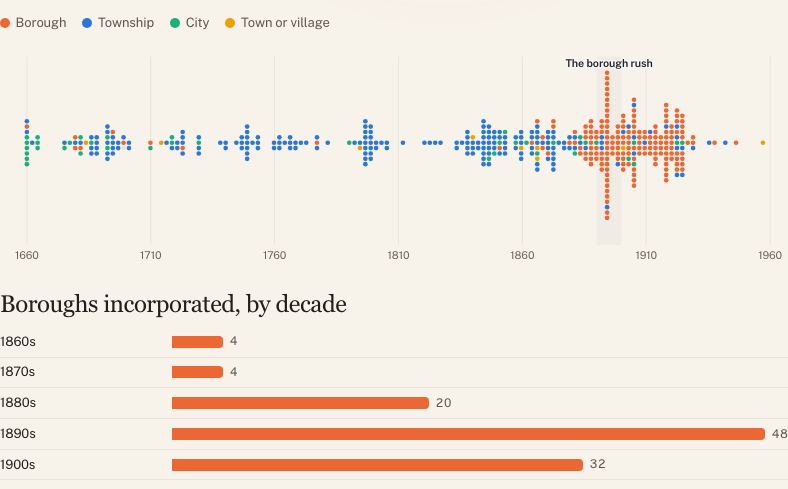
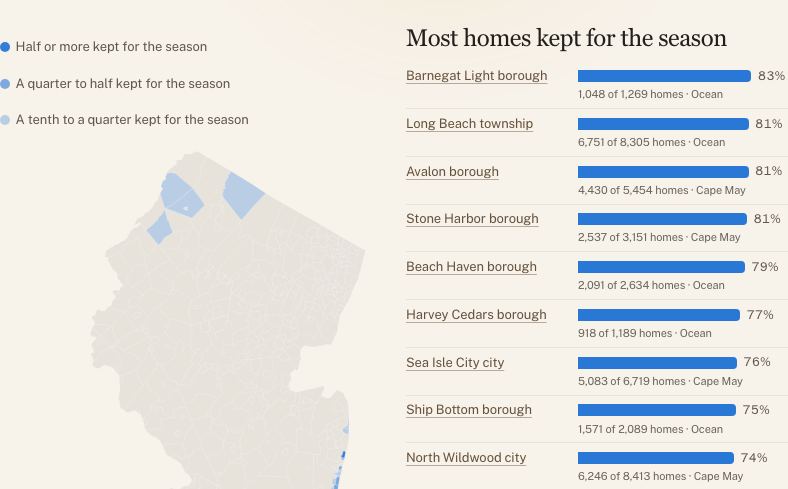
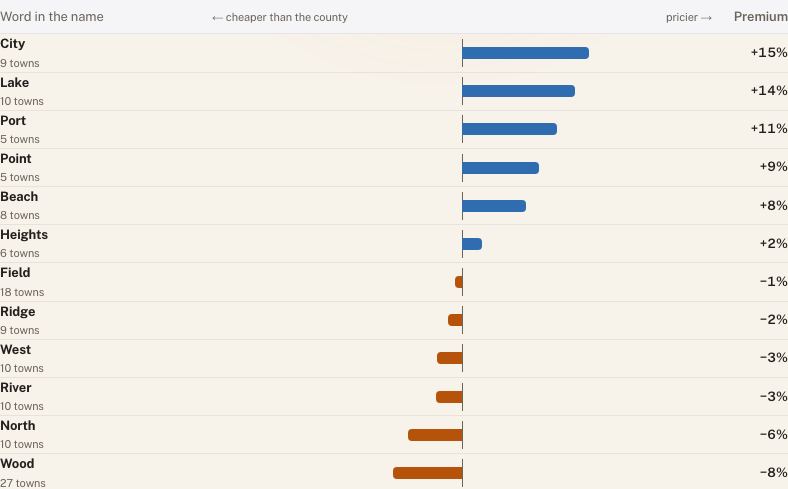
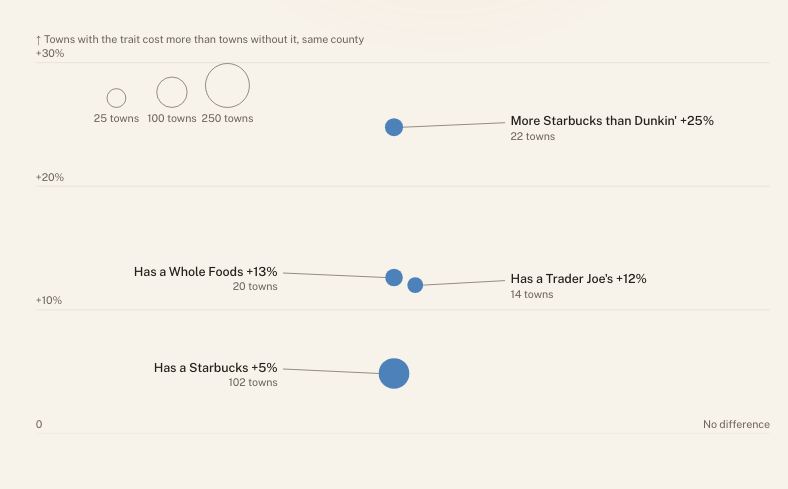
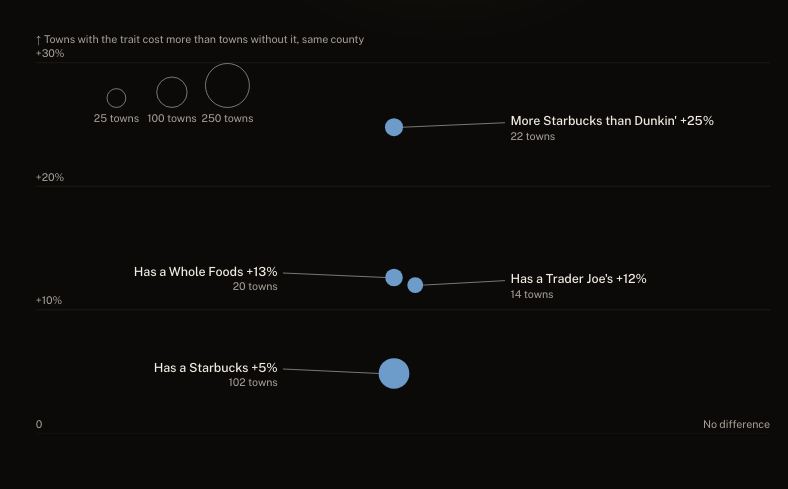
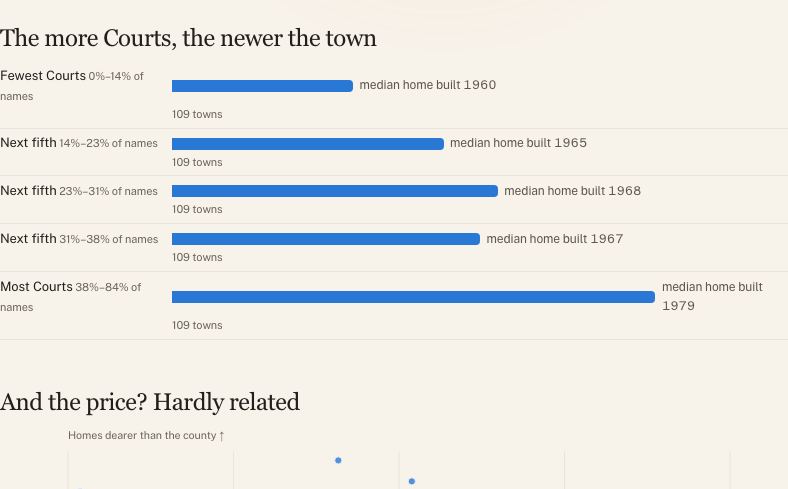
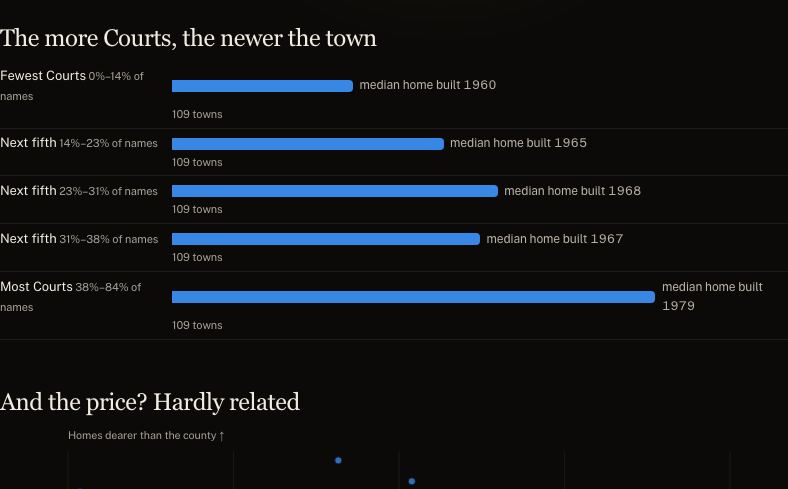
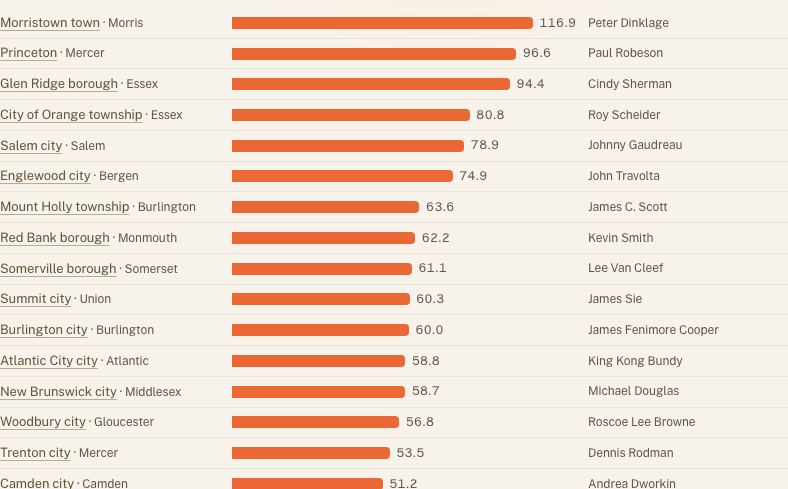
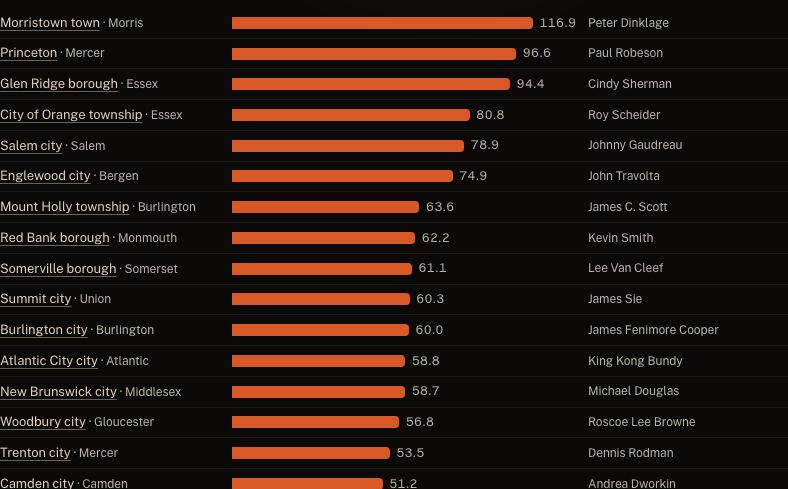
All storiesOnly in New Jersey: the state’s character, drawn from the data.
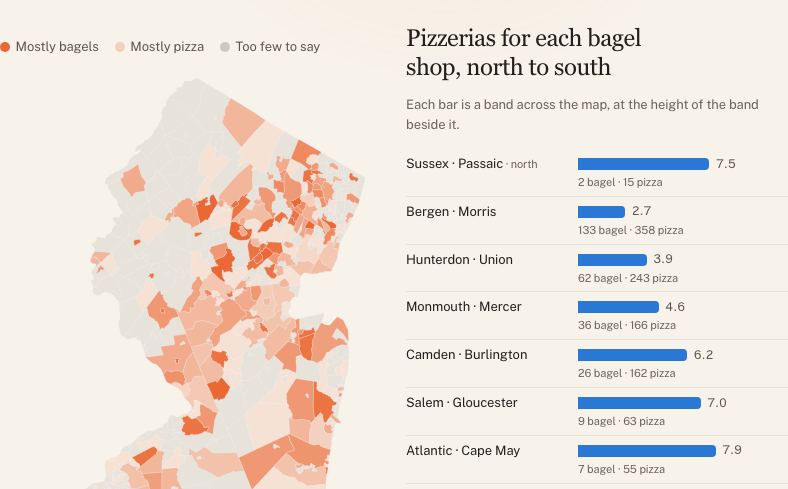
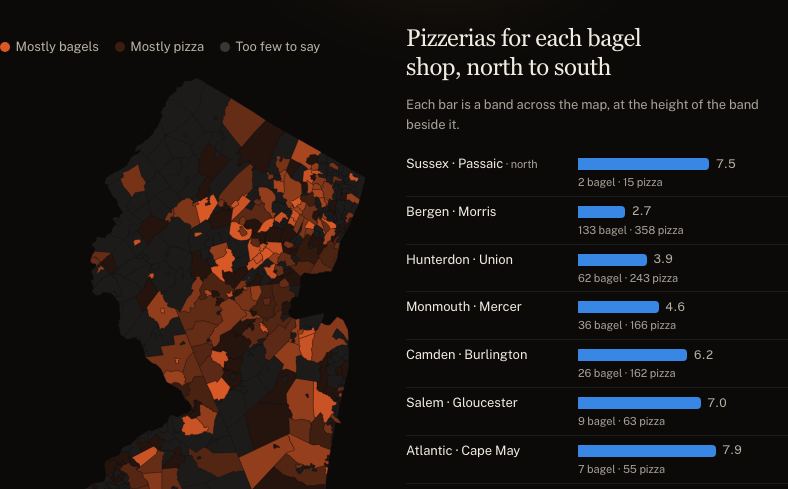
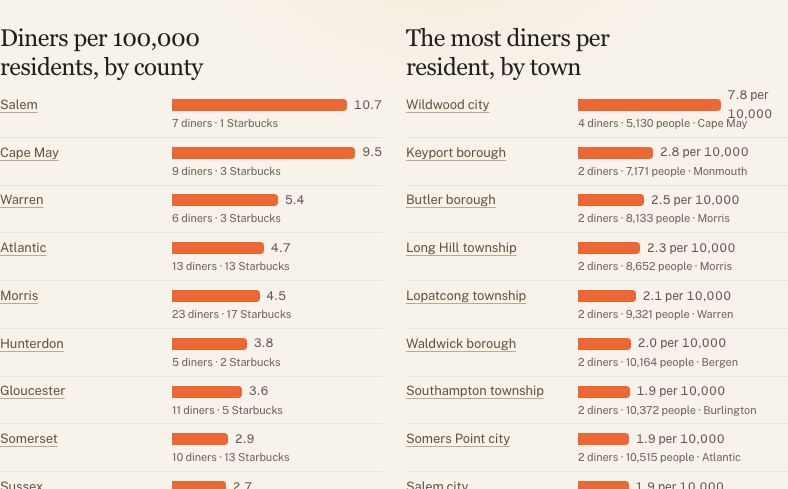
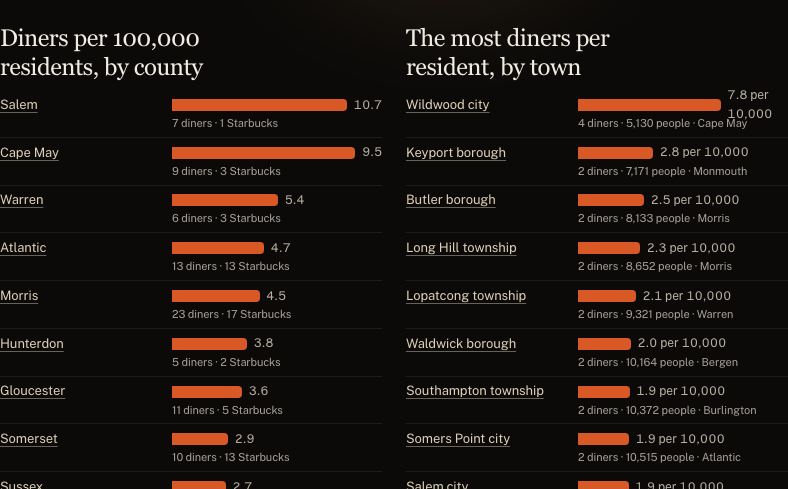
† About the statewide figures
A county's or the state's effective tax rate is worked out here from its towns' published rates, each weighted by the town's equalized valuation in the state's Table of Equalized Valuations: the levy over the value, taken together.
Sale prices describe the one- to four-family homes that sold, not every home: a medianMedian. The middle value: half are above it and half below. Unlike an average, a few very large values do not pull it up. that rises can mean pricier homes changed hands rather than homes becoming worth more. Counties and the state are computed from the deeds themselves, never from town medians.
The sales ratio is a home's assessed valueAssessed value. The value the town puts on a property for tax purposes. It can be far from today’s market price, since towns reassess only every few years. over its sale price. Below 100% means assessments trail the market, which they do more the longer since a town last revalued; it is not a tax rate and says nothing alone about a bill.
Back to the snapshot ↑